What Is MLflow on Databricks?
Databricks is a cloud-based data science, data engineering, and machine learning operations platform based on the lakehouse architecture. This is a new data management architecture that combines the benefits of data lakes and data warehouses.
Managed MLflow is a service built on the open source MLflow platform, developed by Databricks. The service lets you manage the entire machine learning lifecycle with reliability, security, and scalability appropriate for enterprise projects. It provides an integrated environment to track and secure machine learning model training and ML projects running in production.
Managed MLflow can be either fully managed on customer infrastructure, or hosted by Databricks. In addition to open source MLflow capabilities, it offers enterprise-grade security features, experiment management, high availability, and other Databricks features like notebook revision capture.
Related content: Read our detailed guide to MLflow
In this article:
Running MLflow Projects on Databricks
MLflow Projects is a component offering a reusable, reproducible format to package code for data science applications. It includes command-line tools and an API to run projects. You can also integrate it with the Tracking component to automate the recording of your source code’s Git commit and parameters, enabling reproducibility.
Use the following command to run MLflow projects on your Databricks cluster (in the default Databricks workspace):
mlflow run <uri> -b databricks --backend-config
<json-new-cluster-spec>
In this context, <uri> is the URI from a Git repository or a folder that contains an MLflow project, while <json-new-cluster-spec> is the JSON document with your new cluster structure. The Git URI should use the format: https://github.com/<repo>#<project-folder>.
For example, the cluster specification may look like this:
{
"spark_version": "7.3.x-scala2.12",
"num_workers": 1,
"node_type_id": "i3.xlarge"
}
Quick Tutorial: Create Your MLflow Project in Databricks
Use the following steps to build your MLflow project in Databricks:
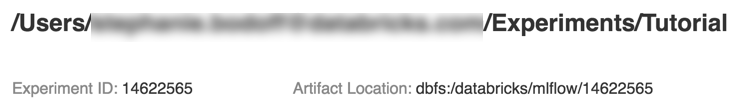
Step 1: Create a new MLflow experiment
1. Select Create in the Databricks workspace and then click MLflow Experiment.
2. Enter the experiment’s name in the Name field.
3. Select Create and pay attention to the experiment ID (in this case, 14622565).

Step 2: Run your MLflow project
Use the following steps to configure the MLFLOW_TRACKING_URI environment variable for your project and record the project’s trained model, training parameters, and metrics for your experiment:
1. Set your chosen Databricks workspace as the MLFLOW_TRACKING_URI environment:
export MLFLOW_TRACKING_URI=databricks
2. Run your MLflow project to train a wine model. Specify the experiment’s ID number in the <experiment-id> element:
mlflow run https://github.com/mlflow/mlflow#examples/sklearn_elasticnet_wine -b databricks --backend-config cluster-spec.json --experiment-id <experiment-id>
Step 3: Check the job run on Databricks
Copy the URL from Step 2 and open it in your browser to view the output of the Databricks job run.

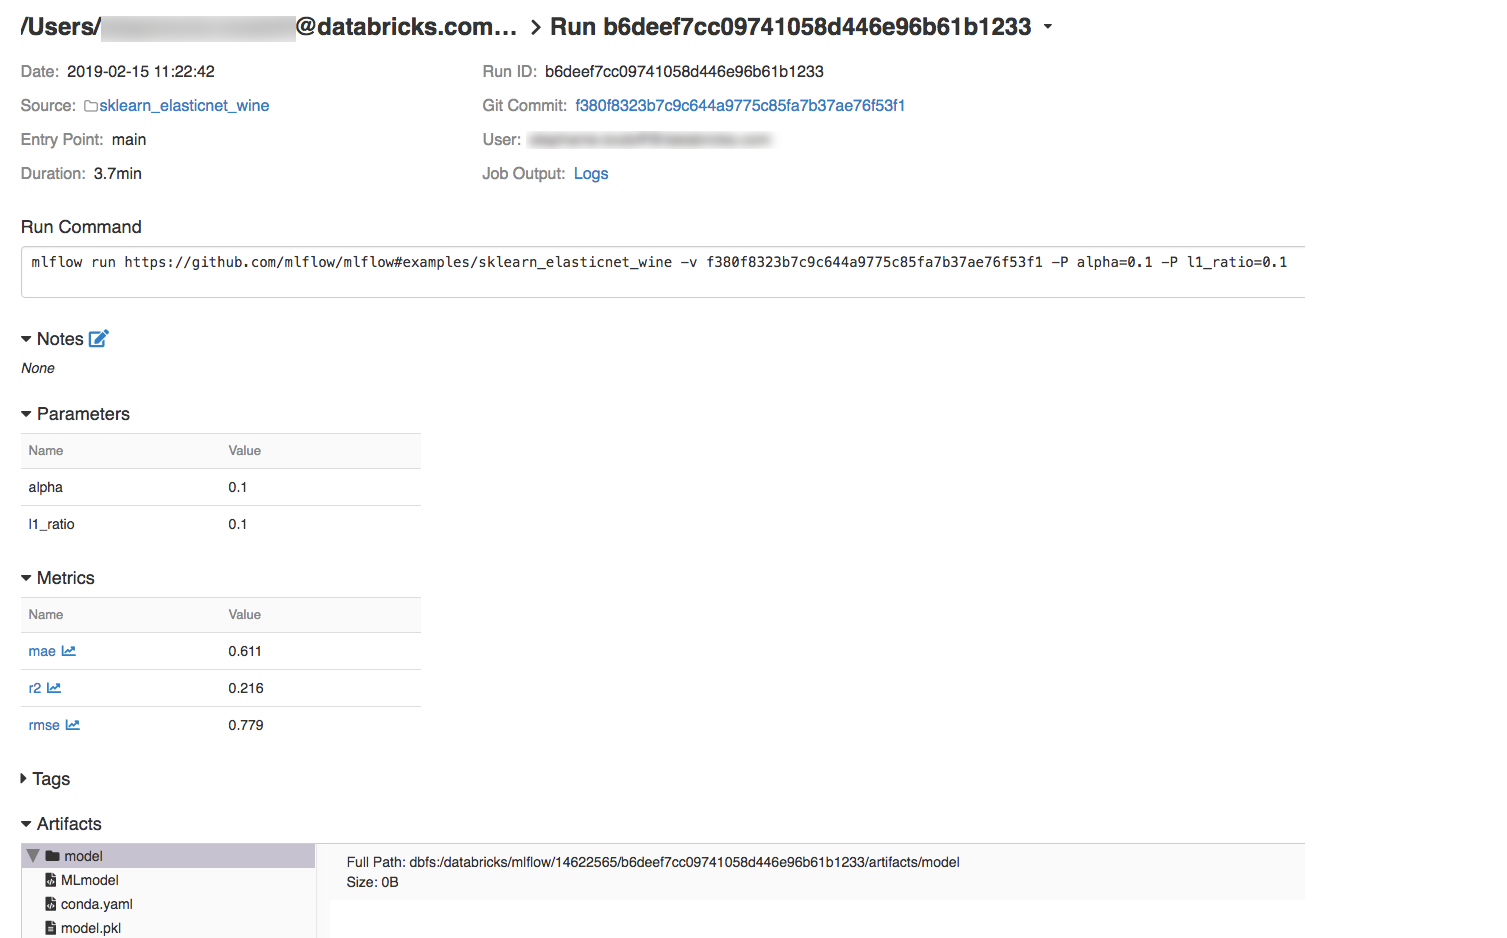
Step 4: View the details of your experiment and MLflow run
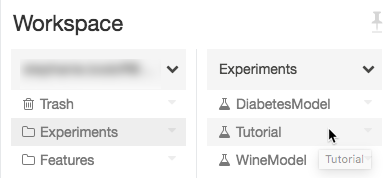
1. In the Databricks workspace, go to your experiment.

2. Select the experiment and display the run details by clicking on the link in the Date column.

3. Click on Logs in the Job Output section to view the logs from the run.
Related content: Read our full MLflow tutorial
Additional Capabilities of MLflow on Databricks
MLflow Model Registry on Databricks
The MLflow Model Registry is a central model repository with a UI and APIs that allow you to manage the entire lifecycle of your MLflow models.
The model registry provides a chronological model lineage (experiments and runs over a certain period), enables model serving and versioning, and performs transitions of models between stages (e.g. from staging environment to production or archive).
The registry also provides webhooks that can automatically trigger tasks based on registry events, sends email alerts about model events, and lets you create and view MLflow model descriptions and post comments.
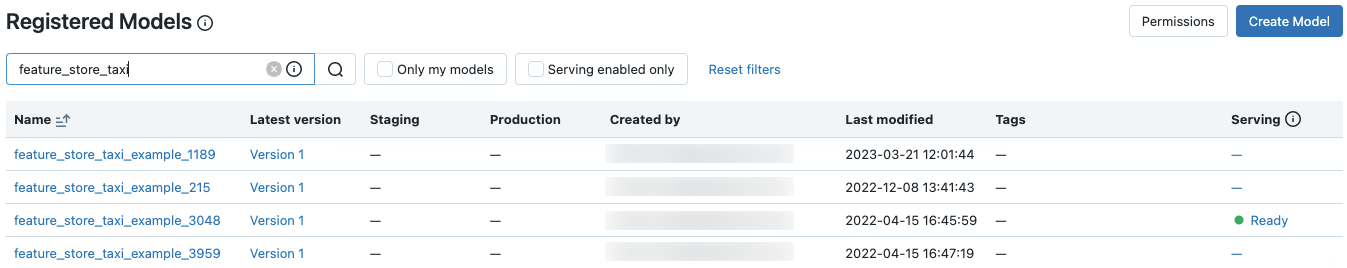
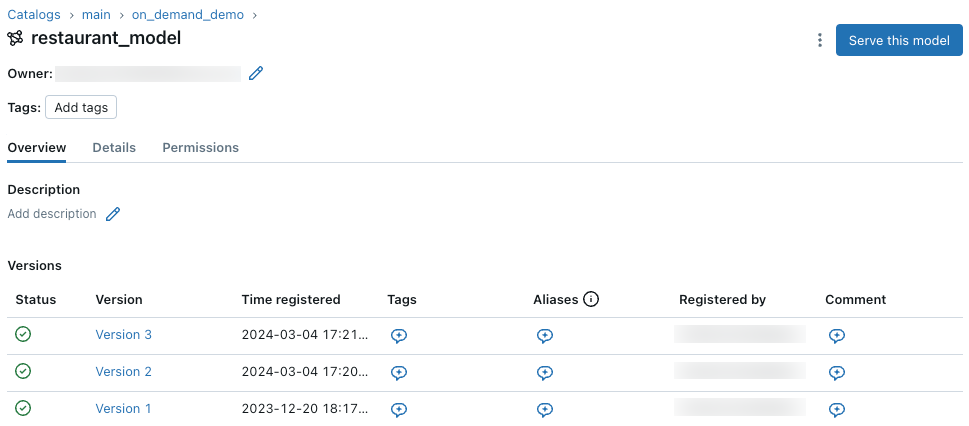
Registered Models page
Click the model icon in the sidebar to open the Registered Models page. This page displays all models of the registry, along with their current stage, time of last modification, service status, and tags. You can click Create Model to create a new model.

You can learn more about a given model by clicking the model name in the Registered Models page. This displays a table detailing the information about your chosen model, including information about each model version.

MLflow Model Serving on Databricks
MLflow Model Serving lets you host Model Registry ML models as REST endpoints. The system automatically updates these endpoints according to the model versions' availability and stages. Here is how it works:
- Enable—once you’ve enabled model serving for the registered model, Databricks will automatically create a cluster for your model and deploy non-archived versions of your model on this cluster.
- Restart—when an error occurs, Databricks will restart the cluster.
- Disable—if you disable model serving for your model, Databricks will terminate the cluster.
- Synch—this process syncs with Model Registry automatically to deploy new registered model versions.
- Query—you can query deployed versions of the model using standard REST API requests. Databricks uses its standard authentication mechanism to authenticate requests to the model.
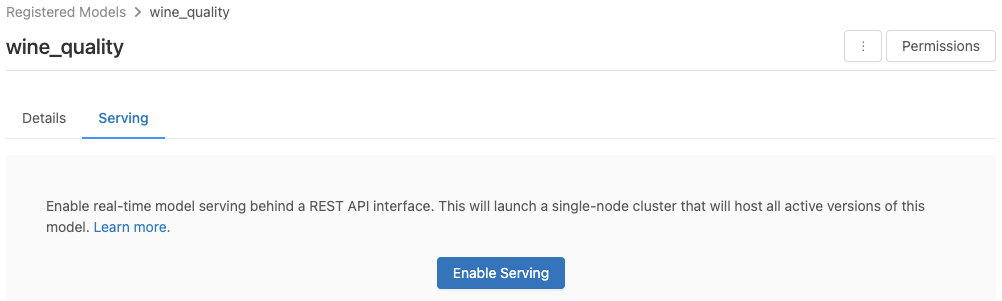
How to enable MLflow model serving on Databricks:
- Go to the Serving tab. If your model is not enabled for serving, you should see the Enable Serving button. Click on the button to enable model serving.

2. The Serving tab appears once you enable model service, displaying a pending status. The status should change to ready after a few minutes.
How to enable or disable MLflow model serving on Databricks:
You can disable model serving by clicking Stop.
Databricks Autologging
Databricks Autologging extends the standard MLflow automatic logging functionality. It is a codeless solution that automatically tracks experiments for ML training sessions on Databricks. It supports models from various popular ML libraries.
Here are key features of Databricks Autologging:
- Capture—automatically captures information when you train models, including model parameters, files, lineage information, and metrics.
- Track—records training sessions as MLflow tracking runs. It also tracks model files to help log them to your MLflow model registry and deploy for scoring in real time using MLflow model serving.
- Notebooks—once you’ve attached an interactive Python notebook to a Databricks cluster, Databricks Autologging starts tracking the model training sessions. It also employs MLflow tracking to automatically track model training data when training models in a notebook.
Managing Machine Learning Infrastructure with Run:ai
With our MLflow integration, jobs can be scheduled with the Run:ai scheduler. For a detailed walkthrough of how to run Jobs with MLflow using the Run:ai scheduler, see our MLflow integration entry in our Documentation Library.
When using MLflow with Run:ai, you enjoy all the benefits of our platform:
Advanced visibility—create an efficient pipeline of resource sharing by pooling GPU compute resources.
No more bottlenecks—you can set up guaranteed quotas of GPU resources, to avoid bottlenecks and optimize billing.
A higher level of control—Run:ai enables you to dynamically change resource allocation, ensuring each job gets the resources it needs at any given time.
Run:ai simplifies machine learning infrastructure pipelines, helping data scientists accelerate their productivity and the quality of their models.
Learn more about the Run:ai GPU virtualization platform.

